
ISSN 2410-5708 / e-ISSN 2313-7215
Year 13 | No. 37 | June - September 2024
© Copyright (2024). National Autonomous University of Nicaragua, Managua.
This document is under a Creative Commons
Attribution-NonCommercial-NoDerivs 4.0 International licence.

Design of a financial analysis model to boost the profitability of MSMEs, Sivareña case study
https://doi.org/10.5377/rtu.v13i37.17959
Submitted on August 02nd, 2023 / Accepted on May 23rd, 2024
Danilo Antonio Martínez Alonzo
Master in Finance, Senior Business Advisor TECHNOSERVE INC.
Erika Janeth Navarrete Mendoza
Master in Finance
PhD student in Education and Social Intervention V Cohort, UNAN-Managua
Donald de Jesús López Almendares
Master in Business Administration with Emphasis in Marketing
Doctoral Student in Education and Social Intervention V Cohort, Universidad Nacional Casimiro Sotelo
Section: Social sciences, Business education and Law
Scientific research article
Keywords: financial analysis; costs; fixed costs; contribution margin; financial model; small business; break-even point; unit price; profitability
Abstract
The objective of this research1 is to design a financial analysis model to boost the profitability of the small and medium-sized company, Sivareña, in whose development the product lines and the maximum growth gap are evaluated as metrics to plan sales goals (gaps), associated to the financial profitability of the business. Likewise, a financial model was implemented as a tool in Microsoft Excel, and the final result proposes adjustments and pricing and cost strategies with financial and market impact to boost the company’s profitability.
The work method has a mixed approach, combining quantitative and qualitative analysis, addressing the most relevant and important variables to deepen the evaluation, analysis, and capacity of proposals for the growth and profitability of the company. Statistical and financial metrics associated with inventories, contribution margin, unit costs, and operating expenses, were used to generate the break-even point and associated gaps, based on the estimation of the company’s buffer coefficient and installed capacity. A multidimensional approach was given according to the approach of the problem to be solved, with a retrospective analysis, and based on this, some useful suggestions for decision-making were proposed.
By way of conclusions, the financial model implemented helped to evaluate the product lines and growth gaps and determine the break-even point of the weighted portfolio (threshold), which facilitated the identification of strategies to plan sales and production goals and the growth of the company’s profitability based on products with higher margins and higher sales frequency (more preferred by diners). In addition, it led to assume strategies such as price adjustment, unit cost updating, and defining the working capital required for growth.
Introduction
The financial management of companies is a field of strategic decisions that affect all areas of the business. Decisions about which product or service lines to push at different levels of priority to generate cash; the required working capital; debt planning; company liquidity and profitability are part of the decision-maker’s challenges. Therefore, the information and quality available, the analysis techniques, and the criteria for working arrangements and actions are relevant and can make a difference in the final results.
With the present proposal, the key indicators of the financial and market model are analyzed to boost the profitability of “Sivareña”, the product lines are evaluated, and the maximum growth gap as metrics to plan its own sales goals (gaps), associated to customer segments and financial profitability of the company.
To achieve this undertaking, a model of financial and market analysis tool in Microsoft Excel is proposed to strengthen and systematize the quantitative analysis and boost the profitability of the company, “Sivareña”, which projects quantitative metrics to plan its growth.
Materials and Methods
It combines quantitative and qualitative research and analysis techniques. The quantitative approach is based on the financial measurements of cost, expense, price, and break-even point, whose variables provide an important basis for the findings and analysis of the company’s performance.
On the other hand, the qualified opinions of management, accounting, and sales managers are relevant aspects that add to the methodological work and provide qualitative assessments of important weight in the findings and recommendations.
The approach given to the present work is multidimensional according to the approach of the problem to be solved, and it is nourished with retrospective analysis, based on this, some useful suggestions for decision-making are proposed. In its development, it will be supported by quantitative instruments (accounting), with qualitative alignment (interview of the entrepreneur).
The sample object of the study is oriented to the area of services sold within the period 2022 in the company Sivareña Pizza, whose research work is based on the estimation of the break-even point for an adequate sample in an intentional way or by convenience of services sold in the company.
For the selection of the sample of transactions or sales of services, a total population of 76 products distributed in five categories was considered, as shown in the table below.
Table 1.
Portfolio of products sold in 2022.
|
Units |
||||
|
Product |
Category # items |
ANNUAL |
Average |
% of the Portfolio |
|
Appetizers |
4 |
11,074.0 |
922.8 |
0.1 |
|
Pizzas |
34 |
25,919.0 |
2,160.5 |
0.3 |
|
Weekday Specialties |
21 |
3,343.0 |
370.5 |
0.0 |
|
Non-Alcoholic Beverages |
9 |
21,226.0 |
1,803.8 |
0.2 |
|
Beers |
8 |
28,776.0 |
2,455.7 |
0.3 |
|
∑ = |
76 |
90,338.0 |
7,713.3 |
100.0% |
Source: Own calculation with company sales data in 2022.
Instruments and research technique
The instruments, and techniques in the research were of the documentary type with documentary analysis technique using the instruments of business model canvas, management diagnosis and information registry, unit costs auxiliary, price list, and product sales reports by month and category. Similarly by content analysis technique through the auxiliary spreadsheet instrument of the break-even point, a spreadsheet of the buffering coefficient, as well as field type utilizing the structured interview technique through a guide of key questions to management and accounting, notebook and images of the researcher, the observation technique was also used with the instrument of photographs, field visit.
Results and discussion
To systematize the information in a more orderly manner, a record was made of sales in units from January to December 2022, supported by Format 1: Products/services of the business of the financial model in Excel, which allowed grouping into categories according to their nature and profile. The results of the descriptive statistics indicate a particular behavior.
Table 2.
Sales by category and revenue generation January to December 2022.
|
Units sold |
Sales in USD and % of USD |
|||||
|
Category |
# items |
Annual |
Average |
% Portfolio |
Revenue USD |
% of Revenue |
|
Appetizers |
4 |
11,074.0 |
922.8 |
0.1 |
30,808.5 |
0.08 |
|
Pizzas |
34 |
25,919.0 |
2,160.5 |
0.3 |
206,882.5 |
0.56 |
|
Weekday specialties |
21 |
3,343.0 |
370.5 |
0.0 |
43,592.0 |
0.12 |
|
Non-alcoholic Beverages |
9 |
21,226.0 |
1,803.8 |
0.2 |
25,913.0 |
0.07 |
|
Beer |
8 |
28,776.0 |
2,455.7 |
0.3 |
62,790.3 |
0.17 |
|
∑ = |
76 |
90,338.0 |
7,713.3 |
100.0% |
369,986.3 |
100.0% |
Source: Own elaboration with information from Sivareña Pizza Management.
After deepening the analysis with a broad perspective of the business performance, a model is proposed employing a Microsoft Excel tool to support the financial and market analysis, and boost the profitability of the small and medium-sized company, “Sivareña”.
The main merit of the proposed financial model is its function of facilitating the analysis of contexts and performance of the company’s finances supported by key variables; in addition, it supports the analysis to propose a “prediction”, whose possibility of fulfillment depends on the implementation of the strategies selected for the fulfillment of the proposed goals according to the analyzed variables.
According to Perez, R (2019), a financial model is an abstraction of the economic and financial situation of a company or organization that serves as a management tool and allows projecting the future results of decisions that are planned to be taken in the present (p 18).
To reiterate the concept and approach, the financial model is the abstract representation of the real situation and problems of the company in question, where the variables to be solved are simplified and highlighted, such as income, prices, costs, and margin, which are associated with a financial and statistical mathematical metric, as appropriate.
Illustration 1.
Types of models
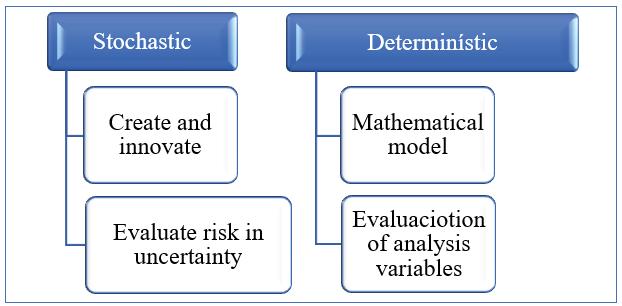
Source: Perez, R (2019). Financial modeling concepts and applications.
The approach of the proposed model
The proposed model is based on Excel -a software developed by Microsoft-, powerful and widely used in the financial world because it greatly facilitates calculations, allowing complex operations to be solved clearly and simply. According to Alemán, C. M., and González Z., E. (2007), it should be used to carry out simulations and to analyze, in different scenarios, the main financial decisions, as well as the impact they would have on an organization.
To define the measures implemented in the proposed financial analysis model, Orellana, L (2001) has been used as a reference to determine the scope of the metrics that help the research, frequency, mean, mode, quartiles or percentiles and graphs.
As Sanchez, M (2013) believes, companies need to detect as quickly and accurately as possible what are their opportunities for improvement in their management, and he defines indicators as instruments that allow evaluating and measuring deviations both in the satisfaction of their customers and in their relationship with internal management indicators or the achievement of strategic objectives.
The proposal of the financial analysis model shared with Sivareña’s management contains a structure and approach that pursues the following purposes:
Sorting the information: Allows to classify and record relevant information in an orderly manner, and that is associated or related to the calculations that contribute to the key financial metrics for the model. These metrics include broad descriptive statistics, means, mode, normal distribution, and percentiles, as well as other valuable economic and financial criteria such as the individual contribution margin of the company’s product portfolio, as well as the buffering coefficient.
Focus on key metrics: Complying with the abstraction principle suggested by Perez, R (2019), the metrics contained in the proposed model are abstracted and rescue important performance variables such as units sold, unit cost, contribution margin, and operating expenses grouped according to their nature, among others. Other metrics such as the composition of the profitability of the products analyzed or the participation of sales within the total portfolio as units or in money, are part of the valuable proposal for managerial analysis.
Concentration, trends, and position analysis: It allows analyzing the performance of the portfolio as income distribution by category of the offer, allowing visualizing the concentration and contributions to the cash generation for the company; it is also possible to observe the temporal performance of the portfolio in money and units sold; operating expenses, among others, by periods such as month, year or average.
The percentile, decile, or quartile position metrics are also a valuable addition to the analysis of the entire portfolio, both in units and money. These observations showed the entrepreneur the need to prioritize within each category of the portfolio, and to focus efforts and working capital on the most valued and frequent items for customers.
Calculating the break-even point: The break-even point is the reference parameter for analyzing performance and planning business growth; it could be said to be the core result of the proposed model. Its calculation allows focusing the analysis on the following areas:
Expected minimums and actual performance: based on its calculation for the portfolio in a weighted manner, it was possible to estimate the minimum sales values and compare them with the actual sales figures achieved, which allows visualizing the buffering coefficient, and its probable gaps. This comparison provides elements to deepen the performance of each sales item.
Margin analysis and cash flow generation: A valuable contribution of the break-even point is the analysis of margins and cash flow generation so that it is possible to quantitatively read which products within their category contribute more to cash flow and profits. From this reading, the entrepreneur made important decisions to adjust its product offering.
Growth gap (maneuvering door): Break-even analyses uncover the maneuvering door (threshold and lintel). In other words, the break-even units versus maximum installed capacity for full utilization clears the way for the planner to define the growth proposal by-product, even to relativize it by seasons.
Estimate the capital required to reach the gaps: Derived from the break-even point and the installed capacity, the varied growth is planned for each line of the portfolio, which, associated with its respective updated unit cost, allows calculating the requirement to meet this growth, and provides data for the financing of future resources, and guidelines for negotiation strategies with suppliers and creditors.
Structure of the proposed model
The proposed structure is simple and consistent with the flow of the required information analysis. Main modules were designed with worksheets for the key variables, and some auxiliary worksheets were also associated with specific calculations that support the main variables (the User’s Manual was prepared).
Below is a basic outline of its structure supported by worksheets for registration and analysis.
Illustration 2.
Structure of the Financial Model
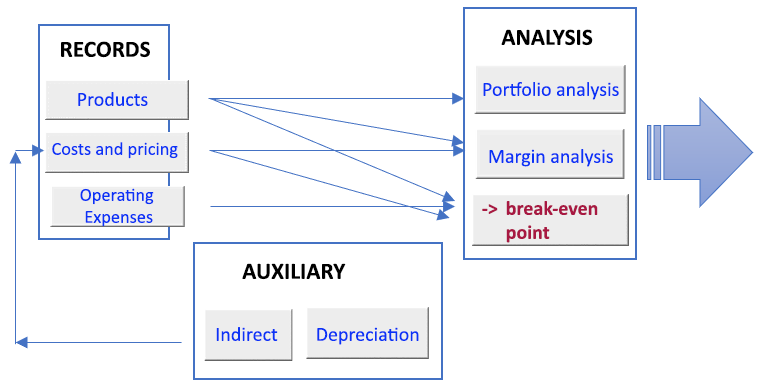
Source: Own elaboration.
The experience in the implementation of the financial model has been a learning experience and has left valuable readings to Sivareña’s management, to the point of continuing with its implementation and sustaining it as a good management practice to support the orderly and systematized analysis in decision-making.
The most valuable aspects of the company are:
• Clear and direct analysis of the product portfolio structure by category.
• Distribution of the portfolio’s revenue generation by category.
• Monthly sales by category (Units)
• Central tendency statistics of the product portfolio
• Revenue and Expense structure analysis of the product portfolio
• Position analysis (Percentiles)
Based on this reading, the most valuable analyses shared by management are as follows:
Key findings:
• Some pizzas that lead in sales have the highest prices. In other words, we do not compete on price, but on quality, and flavor, it is our “differentiation”.
• Analyze the unit margin versus sales frequency: 12 of 30 pizzas have a margin above 50% of the sales price, 17 recipes above 45% on average, and only one recipe below 35%.
• Fourteen recipes represent 80% of the pizza units sold in the year out of a total of 34 registered recipes (21,020 / 25,919 pizzas). We need to review the production plan.
• In terms of revenue, 13 recipes contribute 80% of the annual revenue, and two other groups distribute 10% each to add up to the total sales in 2022. The last group represented by 16 recipes only contributed USD 20.8 thousand, among which 12 pizzas sold less than 10 units per month.
• Position analysis: it is observed that 50% of the group of 34 recipes generated less than USD 3.8 thousand per month in 2022, and a sale of about 485 pizzas or less in the same year. This is almost at the rate of $100 per month, a very low sale in this market.
• According to decile analysis, 40% of recipes are sold at a rate of less than 25 pizzas per month (300 pizzas/12 months), for a revenue generation less than or equal to USD 2,800.
These main summarized findings lead to the following decisions of Sivareña’s Management, namely:
Main decisions:
Leave out products with frequencies less than 30 per month, and assess profit margin. The updated cost is adjusted at a rate of 6.2. Prices are adjusted in a differentiated manner, according to their margin, and their current price. Average previous price: USD 7.28 average adjusted price: USD 8.24. Therefore, the previous average margin: was USD 3.61, new adjusted average margin was USD 4.33 per prescription. Based on Management’s decision, the new distribution for the main products is presented below:
Table 3.
New distribution based on Management’s analysis in implemented model.

Source: Own elaboration with information from the Financial Model
A valuable conclusion and characteristic of this financial model proposed to Sivareña is that it can be replicated in other companies, given its adaptability and flexibility for recording and managing information, which facilitates analysis and decision-making.
Results of the proposed model
The breakeven calculation method in the financial model allows the weighting of the products by categories. Table 4 shows the breakeven point, measured for the year 2022, where for every $1.00 in sales, 0.58 corresponds to pizzas, 0.18 to beers, 0.09 to weekly specialties, and the remainder to Entrees (0.08), and Non-alcoholic beverages (0.07).
Table 4.
Break-even point calculation by product category.

Source: Own elaboration with data from the Financial Model.
When comparing the actual sales for 2022 with the breakeven results, it is corroborated that the company operates above its breakeven. This is indicated by the Buffer Coefficient (BC), whose average -total-, is 0.58, the result of (∑Sales ’22 / ∑ P.E.$) - 1.
Table 5.
Comparative break-even point, actual sales, and cushion coefficient.
|
Category |
Break-even point |
Sales USD ‘22 |
Buffering rate |
|
|
Dollars |
% USD |
|||
|
Pizzas |
136,569 |
0.58 |
206,883 |
0.51 |
|
Beers |
42,434 |
0.18 |
62,790 |
0.48 |
|
Weekday specialty |
20,040 |
0.09 |
43,592 |
1.18 |
|
Appetizers |
18,396 |
0.08 |
30,809 |
0.67 |
|
Non-alcoholic beverages |
17,150 |
0.07 |
25,913 |
0.51 |
|
Total |
234,589 |
1.00 |
369,986 |
- |
Source: Own elaboration with data from the Financial Model.
The BC is the resulting gap between the break-even point and actual sales, it can be negative or positive. In this case, positive, means the maximum space that the company can afford a drop in sales for each category to be at least in balance.
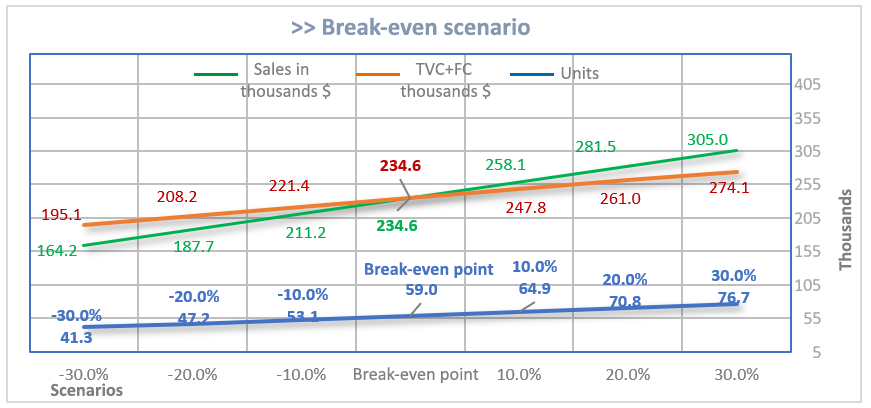
To further analyze the break-even point, scenarios were constructed to assess the probable variations in revenues. The criterion applied is to increase and/or decrease by a rate of 10% of the units produced to plot the results obtained. Namely (Table 6):
Table 6.
Scenarios based on Break-even Point.

Source: Own elaboration with data from the Financial Model.
The scenario of increasing units by 10% increases profit by USD 10.2 thousand per year, and up to USD 20.35 thousand if it is 20% (rates increase by 4, 7, and 10 percent respectively). This shows that, with this cost and expense structure, the leverage to profit is increasing. Otherwise, as the units decrease, the negative rate is higher, and profits decrease.
Illustration 3.
Breakeven point compared to scenarios.
Quantitative impact on the company
The model facilitated analysis and systematization to make key decisions in the management of the business. The following is a breakdown of the quantitative impact achieved for the company’s finances and growth planning:
• Identify its break-even point at USD 234.58 thousand (minimum sales value), and compare it to the 2022 annual sales (USD 369.98 thousand), + USD 135.4 thousand.
• Identify and apply an adjustment to unit costs: + 6.2%.
• Apply differentiated price adjustment, for an average CM of 47% to 51%.
• Project revenues with a 19% growth rate. Take the annual invoice from USD 369.9 thousand (2021) to USD 442.05 thousand in the next year.
• Increase expected earnings by 28% over 2022. (USD 78.6 to 100.9 thousand, i.e. +22.3 thousand).
Qualitative impact on the company
In qualitative terms, the value added by the proposed financial model is associated with the ability of Sivareña’s Management to systematize its information, which allows it to:
• Order and guide the analysis in key variables of its finances and sales performance.
• Measure portfolio cash generation and contribution margins.
• Test performance scenarios to measure the impact on revenues and expenses.
• Control your expenses and costs based on a simple and practical baseline scheme.
• Plan cash flow, plan purchases and gain bargaining power with suppliers based on frequency and volume of purchases.
• Plan and project with greater confidence and certainty, based on your data.
Conclusion
This tool has been validated in different business learning spaces, with businesses of different economic activities, in at least three Central American countries, and can be easily replicated to analyze the financial performance of your business by following basic methods and metrics such as descriptive statistics, trends, position and profitability analysis by product line.
This template has been designed in Excel enabled with macros and code to automate some calculations and allows to register and order of specific information to analyze the performance of the business portfolio, as well as to calculate the break-even point, a reference value to plan the sales growth and profitability of the company in a differentiated way. Its use is directly supported by Microsoft Office.
You too can implement it, and analyze your metrics and key data, this tool will help you to deepen your business performance and optimize decision-making.
This tool is for you an entrepreneur, if you need to:
• Measure the performance of your product or service portfolio, and you want to deepen your analysis to propose strategies to improve the turnover of these.
• Calculate the contribution margin of your portfolio, and understand how each product/service line or category contributes to your company’s profitability.
• Analyze in depth the trends and position measures of your portfolio to make differentiated inventory investment decisions, taking into account your sales frequency, market response, and margins.
• Know the break-even point of your business for the entire weighted portfolio of products and services and attend to the differentiation of the strategies for each product.
• Establish a number to indicate the business threshold for minimum sales, and set minimum sales goals to plan for business growth with your sales team, based on your installed capacity for maximum sales.
• Take business growth seriously, and plan the financial resources required to leverage your profitability.
In short, the user profile for this proposed financial model is the entrepreneur who is concerned about business growth planning, and who lacks adequate tools to deepen the performance of his portfolio, product, or service offerings, whether or not he has formal accounting. That is, business owners or managers who wish to deepen their strategic reading and require ordered data with financial and statistical mathematical support simply and practically, but sufficient to make decisions.
Before implementing the proposed financial model, the small company “Sivareña” lacked financial and market analysis processes to plan its profitability. Management only relied on a periodic weekly, sometimes daily, reading of sales performance, and did not have tools to guide production and sales, and to increase the bargaining power with suppliers for the acquisition of inputs. On the other hand, the high capacity of the owners to propose novel and attractive products.
The proposal of the model as a tool in Microsoft Excel for financial and market analysis to boost the profitability of “Sivareña”, facilitated the identification of strategies to plan sales and production goals and the growth of the company’s profitability based on products with higher margins and higher sales frequency.
Works Cited
Alemán Castilla, M., y González Zavaleta, E. (2007). “Modelos Financieros en Excel”. México: Compañía Editorial Continente
Orellana, Liliana (2001), “Estadística Descriptiva”. Departamento de Matemática de la Facultad de Ciencias Exactas y Naturales de la Universidad de Buenos Aires. Argentina.
Pérez Peña, Rodrigo (2019). Modelación financiera: conceptos y aplicaciones. Bogotá: Universidad Piloto de Colombia.
Sánchez, Manuel (2013), Indicadores: Seguimiento de la gestión en la empresa. V Foro CERPER. España.
Footnotes
1. This research article is part of the research line: Business Finance and the subline Financial Management. It was carried out in the context of the Master's degree in Finance of the Faculty of Economics, which research is presented in its entirety in the thesis presentation.