ISSN 2410-5708 / e-ISSN 2313-7215
Year 13 | No. 38 | October 2024 - January 2025
© Copyright (2024). National Autonomous University of Nicaragua, Managua.
This document is under a Creative Commons
Attribution-NonCommercial-NoDerivs 4.0 International licence.
Dynamics of production, unemployment, and inflation in Nicaragua, period 2012 – 2022 and prospects 2026
https://doi.org/ 10.5377/rtu.v13i38.19315
Submitted on july 10th, 2024 / Accepted on october 10th, 2024
César Augusto Arévalo Cuadra
DSc. Economic Sciences.
National Autonomous University of Nicaragua,
Managua UNAN-Managua.
CUR-Carazo
Ariel Aristides Sánchez Gonzales
MBA. Investment Projects.
National Autonomous University of Nicaragua,
Managua UNAN-Managua.
CUR-Carazo
Modesta Carolina Rojas
MBA. Business Management.
National Autonomous University of Nicaragua,
Managua UNAN-Managua.
CUR-Carazo
Section: Social Sciences, Business Education and Law
Scientific research article
Keywords: Macroeconomics, Production, Unemployment, Inflation, Human Development
SUMMARY
Achieving human development and fighting poverty is the challenge posed in Nicaragua in the period 2022-2026, contemplated in 12 strategic lines: 1) Macroeconomic stability, 2) Reinforce the basic conditions of development; 3) Development of human talents; 4) Public goods and services, for social welfare 5) Deepen equality between genders 6) Youth central axis of development; 7) Improve production in the field; 8) Develop creative economy, 9) Revitalize trade and local and international markets; 10) Inclusive cities, neighborhoods and counties; 11) Measures to mitigate climate change; 12) The Caribbean Coast special zone of human and socioeconomic development. As axes of the purpose, three indicators are analyzed: GDP Gross Domestic Product, Inflation and Unemployment Rate, using time series of the period 2012 - 2022. It is objective to recognize that, during this period, the country was affected by different crises, including world order, which overlapped; such as the one caused in 2018, the health crisis that affected the country since 2020 and the crisis due to the new world order, consecutively and that seriously affected aspects such as the supply chain, the capacities of health systems to deal with the pandemic and international inflation, to mention a few facts; These situations came and caused serious price rises and shortages. However, the country shows a resilient economic behavior; Studying its indicators will allow decisions to continue the fight for economic development.
INTRODUCTION
This article develops the analysis of the three most important macroeconomic variables: production, unemployment, and inflation, from the economic context of Nicaragua in the period 2012 - 2022, with the aim of knowing how the behavior of our economy has been under the results of these indicators; within the framework of the efficient implementation of the National Development Plan, by the government of the Republic. An important precedent for the implementation of the current National Plan to Combat Poverty and for Human Development 2022 - 2026. (GRUN, 2022)
According to the United Nations (UN, 2015) there has been remarkable progress in reducing poverty. Improving society’s standard of living is an essential objective in the formulation of development plans, programs, and projects. This implies improving social welfare standards. At the global level, there is talk of reducing poverty rates, the United Nations analyzes this problem, through the level of per capita income, particularly by the amount of disposable income for consumption per day.
In the Nicaraguan context, the National Human Development Program 2018 – 2021 (GRUN, 2018), to guarantee the well-being of the population, established among its axes: social development, work and prosperity, socio-productive development, local development, and urban development, which is directly oriented to the search for better economic indicators.
According to the Central Bank of Nicaragua (BCN, 2022), Nicaragua’s GDP per capita increased from US$ 1,734.90 in 2012 to US$ 2,327.30 in 2022; a variation of 34%. When considering the period 2012 – 2017, the average year-on-year increase was 4.9%, reflecting the country’s economic growth situation. As a result of the context of the national socio-political crisis and the global economic and health crisis, this indicator was lower in the period 2017 – 2022, in which a year-on-year increase of 1.6% was estimated.
Based on the current economic situation and with a future perspective in Nicaragua, the National Plan to Fight Poverty and for Human Development 2022-2026, contains transformative policies, strategies, and actions that ratify the path of economic growth and the defense, and restitution of the rights of Nicaraguan families, with a reduction in poverty and inequalities. Twelve essential strategic guidelines to continue changing Nicaragua, relevant to develop and incorporate new elements to respond to the complex global and national context. (GRUN, 2022)
The BCN reports that, in 2021, the Nicaraguan economy presented a significant economic recovery, after having been impacted by the COVID-19 pandemic. Economic activity and employment grew, while inflation rose because of higher international inflation. The Central Bank implemented an accommodative monetary policy through greater monetary operations, and a stable exchange rate slippage policy, and promoted the stability of the financial system by ensuring liquidity, which facilitated the growth of deposits and credit (BCN, 2021).
On the other hand, fiscal policy consolidated its position by reducing the public deficit and maintaining sustainable public debt. Meanwhile, the international context favored a greater demand for our export products, although with price increases for imported goods.
What is described in this 2022 – 2026 plan allows us to evaluate the current reality and have a projected idea of the country, based on the results of the period analyzed; in a government approach oriented not only to economic growth but also to human development and the fight against poverty; as the Government Plan was named.
METHODOLOGY
Research Paradigm
Economic research on production, unemployment, and inflation was developed under the positivist paradigm, which focuses on empirical observation and quantitative measurement of social phenomena. With the purpose of establishing general laws based on observable and verifiable data, emphasizing the character of objectivity and replicability of results. According to Comte (1853), positivism is defined as “the system of thought that considers that the only authentic knowledge is that which is obtained through experience and observation”
Research Focus
In the second decade of the twenty-first century, mixed studies have been consolidated as a third approach or research approach in all fields. Just look at the notorious increase in textbooks and academic articles that have been published about them. And in part, its development and acceptance are because various phenomena have always been approached from a mixed perspective in a natural way. (Hernández Sampieri, 2014)
In this research, the mixed approach was used, which involves the analysis of qualitative and quantitative variables, referring to the investigation of the macroeconomic aggregates of production, unemployment, and inflation. They provide a perspective of the social and economic reality of the country; This generates knowledge of the general scope, which is methodologically analyzed through year-on-year growth rates and certain periods, which allow contrasting a fluctuating reality.
Type of Study
The purpose of defining the type of study is to indicate the type of information that is needed, as well as the level of analysis that must be carried out (Méndez Álvarez, 2006).
Descriptive studies seek to specify important properties and characteristics of any phenomenon that is analyzed and describe trends in a group or population (Hernández Sampieri, 2014)
Due to its scope, this research is descriptive; because in the study of the socioeconomic behavior of the country, the phenomenon studied and its components are considered, while macroeconomic concepts and variables are defined. And due to its period of execution, it is defined as transversal, analyzing a period between 2012 - 2022
Methods
Time series are used, with the aim of discovering a pattern in historical data and then extrapolating it into the future; The forecast is based only on past values of the variable we are trying to forecast or on past errors.
Whereas: – past information is available about the variable to be forecasted. – the information can be quantified. – it is reasonable to assume that the pattern of the past will continue to occur in the future. In these cases, a forecast can be made with a time series method or a causal method. (Virrareal, 2016)
Document analysis and data processing
It has been necessary to study documents of various natures: institutional, personal, group, formal or informal. Through them, it was possible to obtain systematized information of interest for the formulation and execution of the study.
Data collection was carried out from secondary official sources, mainly from the Central Bank of Nicaragua. In the first instance, formal information on the subject was recovered, which covers aspects of macroeconomic variables under study: production, unemployment, and inflation for the period 2012 – 2022. Subsequently, growth rates were generated, and existing ones were considered, which allowed a comparative analysis of its behavior, to make projections that contribute to economic decision-making in 2026.
RESULTS
Next, the description of the behavior of macroeconomic variables production, unemployment, and inflation is proposed; based on BCN statistics as of 2022.
Production
When analyzing production, at the macroeconomic level the Gross Domestic Product (GDP) is studied. “… the value of final goods and services produced in the economy during a given period.” (Blanchard, Amighini, & Giavazzi, 2012)
Real GDP is the value of final goods and services produced each year when valued at constant prices. When the value of goods and services produced at constant prices is compared, the change in the volume of output can be measured. (Parkin, Esquivel, & Muñoz, 2007) Nominal GDP is calculated at current prices or market prices. (p.119)
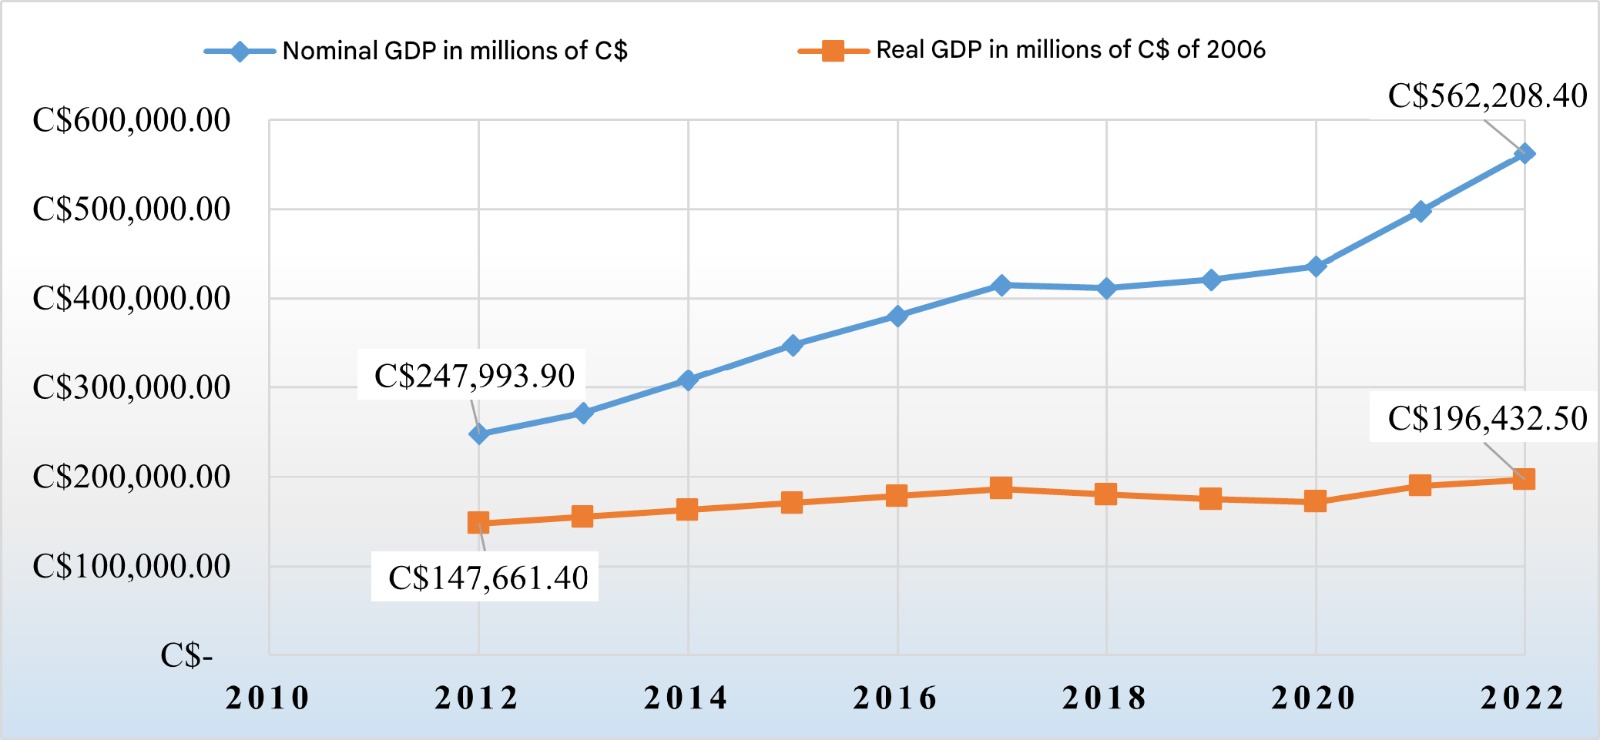
Graphic 1
Real and Nominal GDP of Nicaragua 2012 - 2022
Note: Authors, based on NCB data.
In the period 2012 – 2022, Nicaragua’s economy nominally grew 127%, equivalent to 314,214.50 million córdobas; higher than the real growth of 33%, equivalent to 48,771.10 million córdobas (base price 2006). It can be deduced that the difference between the 94% growth rates is related to the rise in prices and not to the growth in the quantity of production.
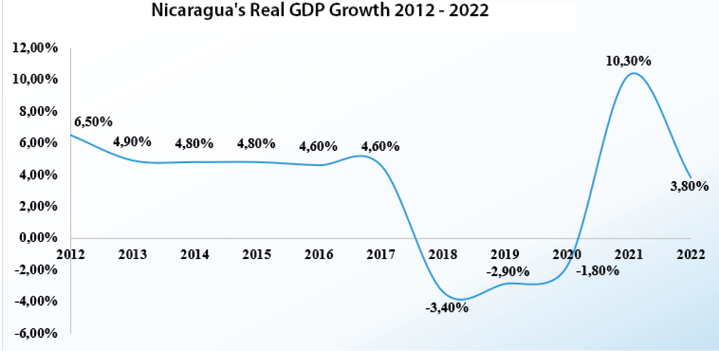
The graph below shows the real GDP growth rates (2006 base price) in the period 2012 – 2022.
Graphic 2
Nicaragua’s Real GDP Growth 2012 - 2022
Note: BCN Macroeconomic Statistics Yearbook
In the period 2012 – 2017, the year-on-year growth rate of the Gross Domestic Product (GDP) was above 4.6%, induced by domestic demand promoted by remittances and foreign direct investment. However, growth was mainly driven by an accumulation of factors (labor and capital) and led by manufacturing operations that require low training.
In 2018 the economy was harmed by a socio-political crisis and the year-on-year growth rate of production was -3.40%, which affected the unemployment rate, and the price level studied as inflation, despite the multiple efforts by the government, to avoid the prolongation of the crisis, which would have had more unfavorable impacts on the national economy; previous estimates of growth thanks to previous accounting records were not achieved; an effect that lasted into 2019 with a year-on-year growth rate of production of -2.90%
In 2020, the year-on-year growth of production was -1.8%, due to the pandemic, which generated tension in the economy over the last few years, however, the improvement in the expectations of economic agents due to the progress in the health system, the favorable external context, the effective response of public policies and the constant promotion of production, had a positive effect on economic activity. This was perceived in the macroeconomic indicators for our country in 2021, with a year-on-year growth rate of production of 10.30%, growth that slowed down in 2022 with a year-on-year rate of 3.80%
The historical and present valuation of goods and services, macroeconomically, allows the calculation of GDP growth rates. From a production approach, the contribution of each economic activity to this indicator is evaluated each year, achieving an analysis of participation and growth rates by activity.
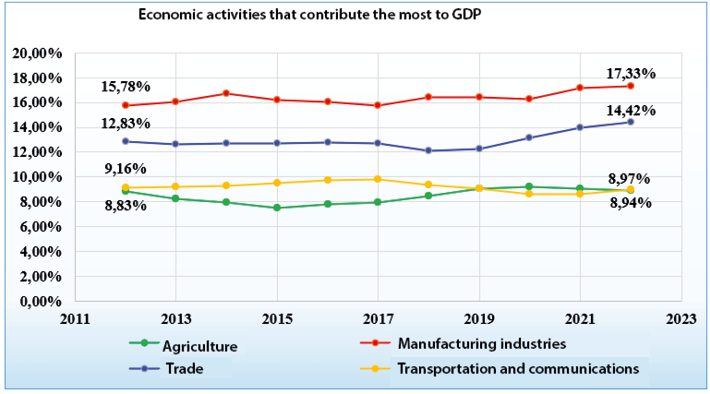
In reference to the activities that contributed the most to Nicaragua’s GDP in the period 2012 - 2022; - Agriculture, - Manufacturing, - Commerce, - Transport, and Communications, are the most representative, contributing between 45% and 49%.
Image 1
Activities that contribute the most to Nicaragua's GDP 2012 - 2022

Between 2012 and 2014, these activities contributed 46.6%, 46.1%, and 46.6% respectively to GDP. In 2015, 45.9%, followed by between 2016 and 2019, respectively, between 46.2% and 46.8%. In 2020 they contributed 47.3%, in 2021 48.8% and in 2022 49.7%
Graphic 3
Economic activities that contribute the most to Nicaragua’s GDP 2012 - 2022
Note: Own elaboration based on BCN data.
Data from the BCN on GDP (production approach), allow us to know the activities that have the highest degree of historical contribution to the country, they are not necessarily those with the best year-on-year growth rates.
The three economic activities that presented the highest level of year-on-year growth fluctuation, based on statistical data from (BCN, 2022), reflected in Nicaragua’s GDP in the period 2012 – 2022, were:
Construction, 21.7% in 2012, 25.4% in 2015, – 32.4% in 2019 and 33% in 2021.
Mining and quarrying, 22.4% in 2013, 15.8% in 2019 and 38.2% in 2021.
Hotels and restaurants 14.8% in 2017, -22.1% in 2018, -31.8% in 2022 and 29.2% in 2022.
Image 2
Economic activities with greater fluctuation 2012 - 2022

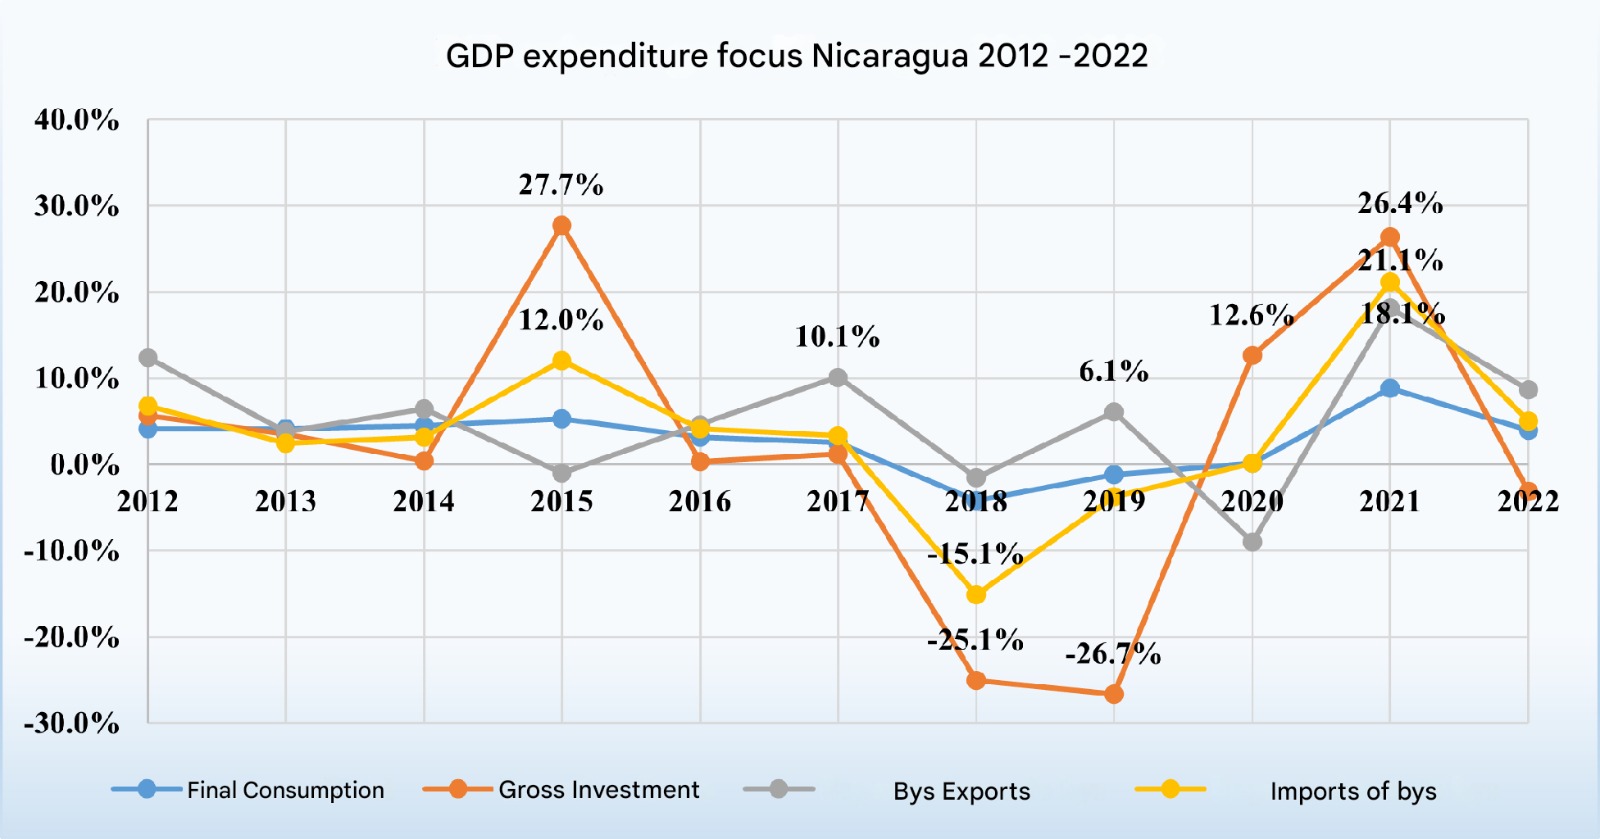
Regarding the analysis under the expenditure approach, it is estimated how GDP is spent, from the concepts: Final Consumption, Gross Investment (Gross Capital Formation), Exports, and Imports.
Final consumption in the period 2012 – 2022 had a year-on-year growth that fluctuated positively on average between 2.5% and 5.3%, except for the years 2020 and 2021 where it increased to 0.1% and 8.8% respectively, and negatively in 2018 and 2019 a year-on-year behavior of -4.2% and -1.2%.
Gross investment (gross capital formation) presented a higher level of year-on-year fluctuation with respect to the growth of the economy, both positively and negatively: 27.7% in 2015, 26.4% in 2021, -25.1% in 2018, and -26.7% in 2019.
The highest levels of year-on-year fluctuation of Exports of goods and services were: 12.4% in 2012, -1.0% in 2015, -1.6% in 2018, -9.0% in 2020 and 18.1% in 2021. The main commercial destinations are the United States, Mexico, Venezuela, El Salvador, Honduras and Costa Rica.
The highest levels of year-on-year fluctuation of Imports of goods and services were: 12.0% in 2015, -15.1% in 2018, -3.8% in 2019, 0.1% in 2020 and 21.1% in 2021. The main countries from which Nicaragua imported were: the United States, China, Mexico, Costa Rica, Guatemala, and Honduras.
Graphic 4
Components of GDP expenditure focus 2012 -2022
Note: Authors, based on data from the BCN
It is worth mentioning the synthetic analysis of the (BCN, 2022) which states that between 2000 and 2017, average growth was 3.9%, driven by domestic demand promoted by remittances and Foreign Direct Investment (FDI). After a two-year recession caused by the socio-political crisis of 2018, the country suffered further declines in economic activity due to the COVID-19 pandemic and the two major hurricanes that occurred in 2020.
Compared to its regional peers, the economic impact of the pandemic was limited due to the moderate containment measures implemented by the government. But real GDP declined by 1.8% in 2020 as voluntary lockdowns weighed on domestic demand, while the global crisis reduced external demand. However, with a cumulative loss amounting to 8.8% since 2018, economic activity in 2021 is estimated to have recovered to pre-2018 levels.
Real GDP growth of 10.3% in 2021 can be attributed to (i) private consumption driven by strong remittance inflows; (ii) consumption and public investment aimed at addressing the impacts of COVID-19 and the damage caused by hurricanes; and (iii) private investment and exports supported by favorable commodity prices. Mining, manufacturing, construction, and trade have been the main engines of growth; Tourism is slowly recovering.
Unemployment
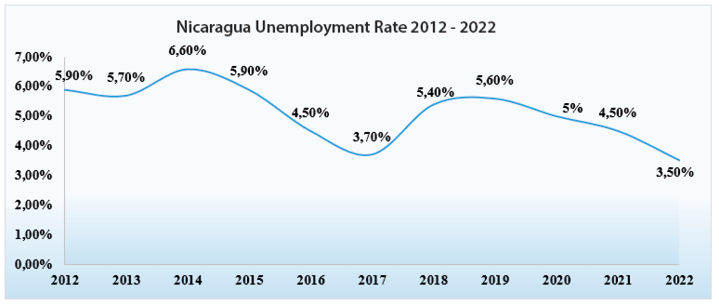
Consistent with the approach to the behavior of the unemployment rate in Nicaragua during the period 2010 – 2020 (Avendaña, 2020), the positive rates of real growth of production are related to the decrease in the unemployment rate.
Graphic 5
Nicaragua Unemployment Rate 2012 - 2022
Note: BCN Macroeconomic Statistics Yearbook 2022
As a result of the government’s good management and consistent with the growth of production, Nicaragua’s unemployment rate went from 5.9% in 2012 to 3.7% in 2017, however, due to the socio-political crisis in Nicaragua and the brake on production and trade, the unemployment rate increased to 5.4% in 2018. and later with the COVID pandemic, the unemployment rate decreased to 5% in 2020, proposing a recovery of the economy in 2022, where it was estimated at 3.5%.
Unemployment is a social problem that affects all economies, both industrialized and less developed countries... “A phenomenon that affects the social, economic and even family and personal spheres. There are various efforts made at the government level to mitigate this problem that generates costs to society.” (Yanes & Cano, 2012)
Around 1.6 million jobs are generated in Nicaragua, contributing to 40% of exports and 35% of GDP, according to the Nicaraguan Council of Micro, Small and Medium Enterprises (Conimipyme). According to the Central Bank, almost 90% of the total number of registered companies are MSMEs.
Their relevance has transcended and continues to be strengthened, updating and carrying out laws, plans, and activities that favor their development to assess the positive impact they generate on the economy. Directorate of Small Businesses of the Ministry of Cooperative and Associative Community Family Economy (MEFCCA, 2020), said: “We have been implementing a plan that has guaranteed the continuous improvement of small businesses in the gastronomy and agribusiness sector, from each of the promotion and marketing spaces directed by this important ministry. We come to make a great alliance with this project for the quality management of micro, small, and medium-sized enterprises.”
Inflation
As for inflation (Fernández, 2008), he defines it as the phenomenon of a pronounced, continuous, generalized, and disorderly rise in the prices of goods and services that results in a significant loss of the purchasing power of the country’s monetary unit.
Graphic 6
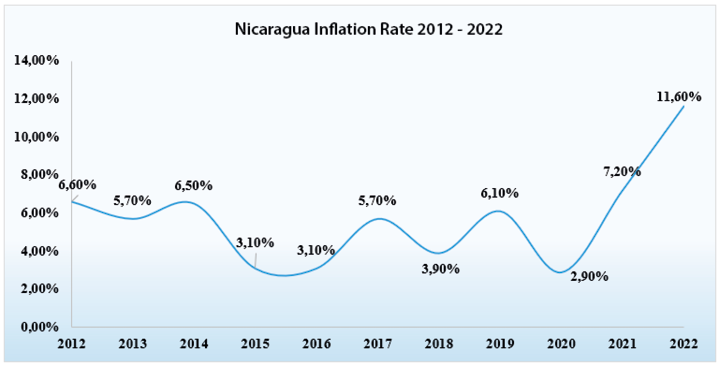
Nicaragua Inflation Rate 2012 - 2022
Note: BCN Macroeconomic Statistics Yearbook 2022
In Nicaragua, it has remained around 3.1% - 6.60% during the last few years, with certain peaks, but returning to the range, with year-on-year fluctuations; however, in the years of recovery and post-pandemic effect, it had behavior above this range of 7.2% in 2021 and 11.6% in 2022; related to the international inflation crisis.
Recent international geopolitical developments will also impact growth, amid elevated oil prices and lower demand, only partially offset by the positive impacts of higher prices of exported commodities.
Production, unemployment and inflation 2012 – 2022
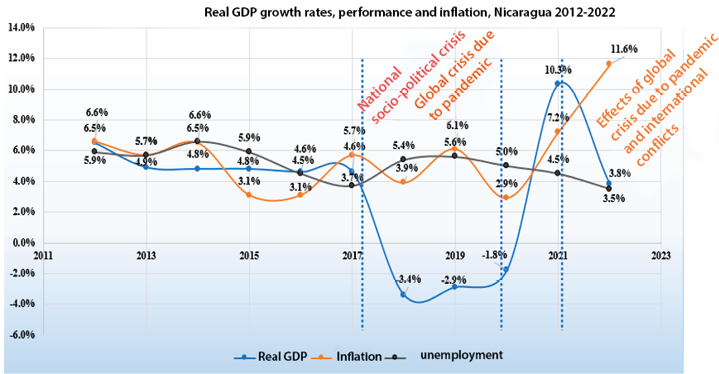
The current domestic political backdrop could influence investment and growth below historical levels throughout the forecast period. Table 1 is presented below, which summarizes the level of production, unemployment, and inflation for the period under study, and Graph 7, illustrates the fluctuations of the variables under study in the period with their combined effect.
Board 1
Behavior Production, unemployment, and inflation Nicaragua 2012 - 2022
|
Period Indicators |
2012 – 2017 Steady economic growth |
2018 – 2020 Socio-political and Health Crisis due to the COVID-19 Pandemic |
2021 Reactivation of the economic system and recovery of the economy |
2022 Post-Pandemic World Crisis and International Conflicts |
|
Production |
Real GDP growth between 4.6% and 6.5% |
Real GDP growth between -2% and -3% |
Real GDP growth of 10.3% |
Real GDP growth of 3.8% |
|
Inflation |
Rates ranging from 3.1% to 6.6% |
Rates ranging from 2.9% to 6.1% |
7.2% rate |
Rate of 11.6% |
|
Unemployment |
Rates that fluctuate between 3.7% and 6.6% |
Rates ranging from 5.0% to 6.1% |
4.5% rate |
3.5% rate |
Graphic 7
Real GDP Growth Rate, Unemployment and Inflation Nicaragua 2012 - 2022
Note: Prepared by the authors, based on data from the BCN
CONCLUSIONS
Nicaragua’s economic expansion in 2021, as in the countries of the Latin American and Caribbean region, was facilitated by relatively favorable external conditions, which affected trade flows and external financing; An attractive sign of recovery of the national economy, in the same way, the contribution of SMEs for Nicaraguan families is considered, whose have emerged as a strategy to counteract unemployment, after the negative behavior of macroeconomic indicators due to the socio-political crisis in 2018 and pandemic in 2020
As the period under study has been defined as corresponding to 2012 -2022, the results of the analysis propose scenarios of interrupted growth followed by recovery. It was possible to perceive the existing correlation between the variables under study, production, employment, and inflation.
Between 2012 and 2017 there has been real growth in production (GDP), between 2018 and 2020 the economy has been affected by phenomena; the socio-political-economic crisis and pandemic, which has affected production, which for 2021 shows signs of recovery. In 2022, the rate of 3.8% shows a slowdown in the growth of the economy, according to the effects of the post-pandemic international crisis.
The unemployment rate between 2012 and 2017 had a decreasing behavior related to the growth of production, however, in the years 2018 to 2021, it had an increasing behavior, which is linked to the impact of the socio-political crisis and pandemic.
Nicaragua’s inflation levels in the period studied have remained within the ranges considered stable; which does not imply that all product prices behave in the same way, and it has been referred to that the problem of affecting the price levels of products outside the expected behavior is associated with the socio-political and health crises 2018 – 2022, the latter with a level of international impact.
Work cited
Avendaña, N. (2020). The Thought of a Post Keynesian. https://nestoravendano.wordpress.com/.
BCN. (2021). Annual Report. Retrieved from happy://www.bcn.gob.ni
BCN. (2022). Yearbook of Macroeconomic Statistics. Managua, Nicaragua.
Blanchard, O., Amighini, A., & Giavazzi, F. (2012). Macroeconomics. Madrid: Pearson Educación S.A.
Comte, A. (1853). Course in positive philosophy (M. M. G. de la L. and C. P. de M. M., Trans.). https://www.academia.edu/29821164/curso_de_filosof%C3%ADa_positiva_august_comte
Fernández, J. (2008). Restatement of Financial States in Venezuela. Venezuelan Journal of Management.
GRUN. (2018). National Human Development Plan.
GRUN. (2022). National Plan for the Fight Against Poverty and Human Development 2022 - 2026.
Hernández Sampieri, R. (2014). Research Methodology. Colombia: McGRAW-HILL / INTERAMERICANA EDITORES, S.A. DE C.V.
MEFCCA. (2020). MEFCCA aims to strengthen SMEs in Nicaragua. https://www.economiafamiliar.gob.ni/websitemefcca-mvc/noticia-mefcca-apunta-fortalecimiento-pymes-nicaragua/526
Méndez Álvarez, C. E. (2006). Methodology. Limusa.
UN. (2015). United Nations. Ending poverty: https://www.un.org/es/sections/issues-depth/poverty/index.html
Parkin, M., Esquivel, G., & Muñoz, M. (2007). Macroeconomics. Mexico: Pearsón Educación.
Virrareal, F. (2016). Introduction to Forecasting Models. www.matematica.uns.edu.ar/uma2016/material/Introduccion_a_los_Modelos_de_Pronosticos.pdf
Yanes, & Cano. (2012). Typology of unemployment: an analysis through the Beveridge Curve. http://www.redalyc.org/articulo.oa?id=194224362012